 Prof. J.P.N. Mishra
At the onset of experiment the mean of MW of the experimental group was 100.9014 ± 22.43859 lit/min. and it was increased to 111.1549 ± 19.16369 lit/min. after 2 months 116.1127 ± 19.90876 after 6 months and 121.3239 ± 20.67350 after 12 months of yoga and preksha meditation intervention.
This change was statistically significant. But the same in control group of subjects were 100.38 ± 22.62954 lit/min. at the onset and was found to be almost similar 100.9718 ± 22.93218 lit/min. with no improvement at 2 months, 101.3521 ± 23.31652 after 6 months and 101.7746 ± 23.81428 after 12 months (Table R 16 and R 17).
Table R 16: Experimental group
| Duration | Mean (sec.) | SD | SE | 'A' |
| 0D | 100.901 | 22.438 | 2.662 | 0.018*** |
| 2M | 111.154 | 19.163 | 2.274 | |
| 0D | 100.901 | 22.438 | 2.662 | 0.015*** |
| 6M | 116.112 | 19.908 | 2.362 | |
| 0D | 100.901 | 22.438 | 2.662 | 0.015*** |
| 12M | 121.323 | 20.673 | 2.453 | |
| 2M | 111.154 | 19.163 | 2.274 | 0.018*** |
| 6M | 116.112 | 19.908 | 2.362 | |
| 2M | 111.154 | 19.163 | 2.274 | 0.017*** |
| 12M | 121.323 | 20.673 | 2.453 | |
| 6M | 116.112 | 19.908 | 2.362 | 0.017*** |
| 12M | 121.323 | 20.673 | 2.453 |
Table R 17: Control group
| Duration | Mean (sec.) | SD | SE | 'A' |
| 0D | 100.3803 | 22.62954 | 2.68563 | 1.6627 NS |
| 2M | 100.9718 | 22.93218 | 2.72155 | |
| 0D | 100.3803 | 22.62954 | 2.68563 | 0.4685 NS |
| 6M | 101.3521 | 23.31652 | 2.76716 | |
| 0D | 100.3803 | 22.62954 | 2.68563 | 0.6472 NS |
| 12M | 101.7746 | 23.81428 | 2.82624 | |
| 2M | 100.9718 | 22.93218 | 2.72155 | 1.3877 NS |
| 6M | 101.3521 | 23.31652 | 2.76716 | |
| 2M | 100.9718 | 22.93218 | 2.72155 | 0.6157 NS |
| 12M | 101.7746 | 23.81428 | 2.82624 | |
| 6M | 101.3521 | 23.31652 | 2.76716 | 1.1326 NS |
| 12M | 101.7746 | 23.81428 | 2.82624 |
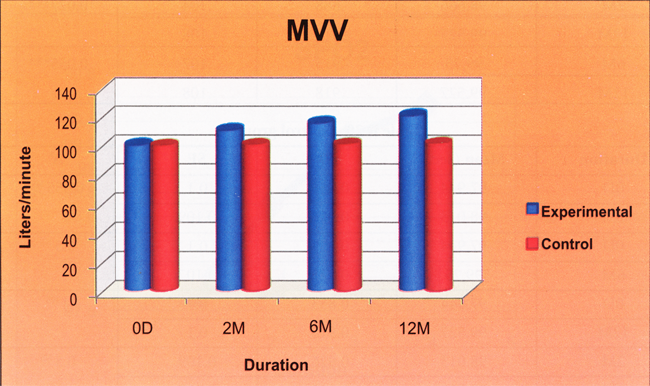
When the values of three stages of observations in both the groups were compared with each other it was noticed that after 1st follow-up stage a significant difference (P<0.0001) occurs and the mean value of experimental group increases up to 116.1127 ± 19.90876 lit/min. and the mean value of control group insignificantly changes to 100.9718 ± 22.93218 lit/min. Similar significant changes (P < 0.0001) persists at 2nd and 3rd follow-up (6 and 12 months) (Table R 18; Fig. R 28).
Table R 18: Inter-group comparison of MW at different follow-up periods in control and experimental subjects.
| Group | Duration | Mean (sec.) | SD | SE | 't' |
| Experimental | 0D | 100.901 | 22.438 | 2.662 | 0.265 NS |
| Control | 0D | 100.380 | 22.629 | 2.685 | |
| Experimental | 2M | 111.154 | 19.163 | 2.274 | 5.047# |
| Control | 2M | 100.971 | 22.932 | 2.721 | |
| Experimental | 6M | 116.112 | 19.908 | 2.362 | 6.871# |
| Control | 6M | 101.352 | 23.316 | 2.767 | |
| Experimental | 12M | 121.323 | 20.673 | 2.453 | 8.552## |
| Control | 12M | 101.774 | 23.814 | 2.826 |
Fig. R 28: Comparison of MW at different follow-up periods in control and experimental subjects