 Prof. J.P.N. Mishra
The basal mean values of VC in control and experimental group of subjects were 3.2494 ±.61377 L and 3.2666 ±.60005 L respectively. After 90 days of yoga and preksha meditation practice, the value increased to 3.4673 ±.58644 L in experimental group showing statistical significance (P < 0.0005) but in control group it remains in the same range 3.2675 ±.61809 L. (Table R 10)
Table RIO: Experimental group
| Duration | Mean (sec.) | SD | SE | 'A' |
| 0D | 3.266 | 0.6 | 0.071 | 0.016*** |
| 2M | 3.467 | 0.586 | 0.069 | |
| 0D | 3.266 | 0.6 | 0.071 | 0.015*** |
| 6M | 3.668 | 0.583 | 0.069 | |
| 0D | 3.266 | 0.6 | 0.071 | 0.015*** |
| 12M | 3.876 | 0.586 | 0.069 | |
| 2M | 3.467 | 0.586 | 0.069 | 0.016*** |
| 6M | 3.668 | 0.583 | 0.069 | |
| 2M | 3.467 | 0.586 | 0.069 | 0.015*** |
| 12M | 3.876 | 0.586 | 0.069 | |
| 6M | 3.668 | 0.583 | 0.069 | 0.015*** |
| 12M | 3.876 | 0.586 | 0.069 |
The mean values of vital capacity of both the groups were compared after 180 days of experimental intervention. It showed a significant increase in experimental group of subjects (P < 0.0005), which was increased to 3.6680 ±.58391 and 3.8762 ±.58674 L from the basal value of 3.2666 ±.60005 L. However in control group no such change was noticed and the values remain in the same range of 3.2855 ±.62776 and 3.3055 ±.64486 L (Table R 10 and R 11).
Table R 11: Control group
| Duration | Mean (sec.) | SD | SE | 'A' |
| 0D | 3.249 | .613 | .072 | 0.375 NS |
| 2M | 3.267 | .618 | .073 | |
| 0D | 3.249 | .613 | .072 | 0.43 NS |
| 6M | 3.285 | .627 | .074 | |
| 0D | 3.249 | .613 | .072 | 0.43 NS |
| 12M | 3.305 | .644 | .076 | |
| 2M | 3.267 | .618 | .073 | 0.93 NS |
| 6M | 3.285 | .627 | .074 | |
| 2M | 3.267 | .618 | .073 | 0.622 NS |
| 12M | 3.305 | .644 | .076 | |
| 6M | 3.285 | .627 | .074 | 0.751 NS |
| 12M | 3.305 | .644 | .076 |
Table R 12: Inter-group comparison of VC at different follow-up periods in control and experimental subjects.
| Group | Duration | Mean (sec.) | SD | SE | 't' |
| Experimental | 0D | 3.266 | 0.6 | 0.071 | 0.384 NS |
| Control | 0D | 3.249 | 0.613 | 0.072 | |
| Experimental | 2M | 3.467 | 0.586 | 0.069 | 4.308# |
| Control | 2M | 3.267 | 0.618 | 0.073 | |
| Experimental | 6M | 3.668 | 0.583 | 0.069 | 7.501## |
| Control | 6M | 3.285 | 0.627 | 0.074 | |
| Experimental | 12M | 3.876 | 0.586 | 0.069 | 10.327## |
| Control | 12M | 3.305 | 0.644 | 0.076 |
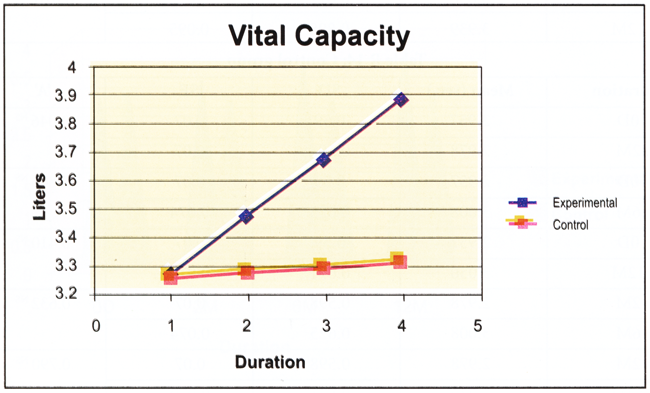
The difference in the mean values of vital capacity were also found to be significant when the same of control group were compared with the mean values of experimental group at various intervals as depicted in Table R 12 and Fig. R 26.
Fig. R 26: Comparison of vital capacity at different follow-up periods in control and experimental subjects