 Prof. J.P.N. Mishra
The quantitative value of HDL in the control group of subjects remain all most same throughout the duration of study. It was 38.0882 ± 2.82164 mg/dl at 0 day, and 38.2941 ± 2.26340,38.4706 ± 2.16354 mg/dl at 90 and 180 days respectively. In the experimental group of subjects the mean value of HDL at 0 day was 38.1765 ± 2.52827 mg/dl. It rises to 38.7059 ± 2.32938 mg/dl, which was found to be significant when compared to the counterpart mean value of experimental group at 0 day. However, there was a further increase in the mean HDL level and it reached to 39.2647 ± 2.24700 mg/dl at 180 days. This increase was statistically significant (p < 0.0005) when compared with the initial value at 0 day. The difference found between the mean values of this group at 90 and 180 days was also significant (p £ 0.0005) (Table C9, C10 and C11).
Table C9: Intra-group comparison of HDL levels of control and experimental group of subjects after 90 days follow-up duration.
| Group | Duration | Mean (mg/dl) | SD | SE | 't' |
| Control | 0 day | 38.0882 | 2.82164 | 0.48391 | 0.959 |
| 90 days | 38.2941 | 2.26340 | 0.38817 | ||
| Experimental | 0 day | 38.1765 | 2.52827 | 0.43359 | 0.0864*** |
| 90 days | 38.7059 | 2.32938 | 0.39949 |
Table CI0: Intra-group comparison of HDL levels of control and experimental group of subjects after 180 days follow-up duration.
| Group | Duration | Mean(mg/dl) | SD | SE | 'A' |
| Control | 0 day | 38.0882 | 2.82164 | 0.48391 | 0.3964 |
| 180 days | 38.4706 | 2.16354 | 0.37104 | ||
| Experimental | 0 day | 38.1765 | 2.52827 | 0.43359 | 0.0474*** |
| 180 days | 39.2647 | 2.24700 | 0.38536 |
Fig. R16: Comparison of high density lipoprotein levels of control and experimental group of subjects at various follow-up stages.
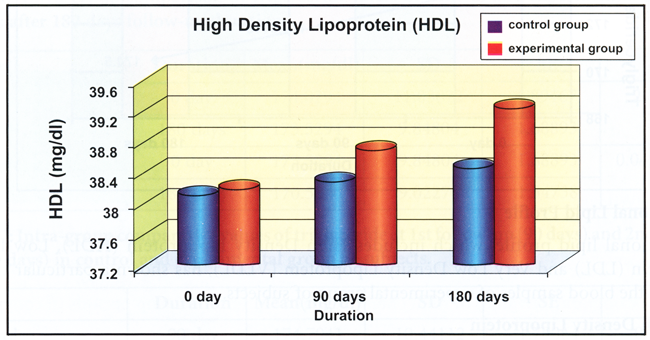
Table C11: Intra-group comparative values of HDL at 1st follow-up (90 days) and 2nd follow-up (180 days) in control and experimental group of subjects.
| Group | Duration | Mean(mg/dl) | SD | SE | 'A' |
| Control | 90 day | 38.2941 | 2.26340 | 0.38817 | 0.7222 |
| 180 days | 38.4706 | 2.16354 | 0.37104 | ||
| Experimental | 90 day | 38.7059 | 2.32938 | 0.39949 | 0.0974*** |
| 180 days | 39.2647 | 2.24700 | 0.38536 |
The mean values of HDL in control and experimental group of subjects at different follow-up periods (90 and 180 days) have shown a statistically significant difference (Table C12) (Fig. R6).
Table C12: Comparative values of HDL at different follow-up periods in control and experimental subjects.
| Group | Duration | Mean (mg/dl) | SD | SE | 't' |
| Control | 0 day | 38.0882 | 2.82164 | 0.48391 | -.594 |
| Experimental | 0 days | 38.1765 | 2.52827 | 0.43359 | |
| Control | 90 day | 38.2941 | 2.26340 | 0.38817 | -3.230# |
| Experimental | 90 days | 38.7059 | 2.32938 | 0.39949 | |
| Control | 180 day | 38.4706 | 2.16354 | 0.37104 | -4.893## |
| Experimental | 180 days | 39.2647 | 2.24700 | 0.38536 |