 Prof. J.P.N. Mishra
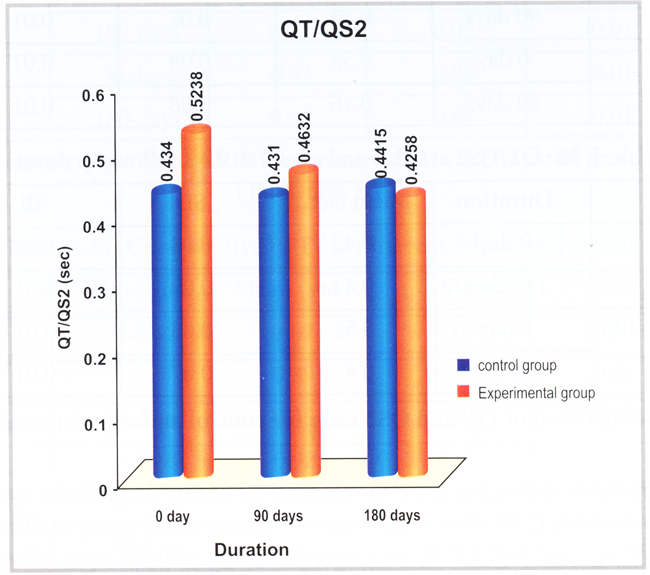
The significant comparative decreasing trend in mean values of QT/QS2 ratio in experimental group of subjects were shown in Table E 30 when mean values of experimental group at different stages (90 and 180 days) (0.46 ± 0.08 sec. and 0.42 ± 0.07 sec.) were. Compared with the same of control group (0.43 ± 0.07 sec. and 0.44 ± 0.09 sec.). QT/QS2 ratio of experimental group when compared with control group at different stages (0 days and 90 days) an improving trend was noticed in experimental group of subjects (0.43 ± 0.08 and 0.43 ± 0.07); Fig. 13).
Table E 29: QT/QS2 ratio values on 90 days and 180 days
| Group | Duration | Mean (sec) | SD | SE | 'A' |
| Control (n=30) | 90 days | 0.43 | 0.07 | 0.01 | 0.83NS |
| 180 days | 0.44 | 0.09 | 0.01 | ||
| Experimental (n=30) | 90 days | 0.46 | 0.08 | 0.01 | 0.05 *** |
| 180 days | 0.42 | 0.07 | 0.01 |
Table E 30: Comparative QT/QS2 ratio values at different follow-up periods
| Group | Duration | Mean (sec.) | SD | SE | 't' |
| Control | 0 day | 0.43 | 0.08 | 0.01 | 0.7NS |
| Experimental | 0 day | 0.52 | 0.08 | 0.01 | |
| Control | 90 days | 0.43 | 0.07 | 0.01 | 0.14NS |
| Experimental | 90 days | 0.46 | 0.08 | 0.01 | |
| Control | 180 days | 0.44 | 0.09 | 0.01 | 0.001## |
| Experimental | 180 days | 0.42 | 0.07 | 0.01 |
The results reveal that hypothesis no. 5 is accepted.
Fig. R 13. Comparative values of QT/QS2 ratio of control and experimental group of subjects at various schedules of observations.