 Prof. J.P.N. Mishra
At the onset of the experiment the mean EMG value of the experimental group of subjects was 587.5833 ± 44.69009 mv. and it was reduced to 556.8611 ± 43.11639 mv. after two months of experimental intervention. This change was statistically significant at P < 0.0005 level. However in control group no such change was observed (Table Ml).
Table M 1: Experimental group
| Duration | Mean (sec.) | SD | SE | 'A' |
| 0D | 587.583 | 44.69 | 5.266 | 0.018*** |
| 2M | 556.861 | 43.1163 | 5.081 | |
| 0D | 587.583 | 44.69 | 5.266 | 0.016*** |
| 6M | 523.069 | 40.073 | 4.722 | |
| 0D | 587.583 | 44.69 | 5.266 | 0.016*** |
| 12M | 490.125 | 43.632 | 5,142 | |
| 2M | 556.861 | 43.116 | 5.081 | 0.017*** |
| 6M | 523.069 | 40.073 | 4.722 | |
| 2M | 556.861 | 43.116 | 5.081 | 0.017*** |
| 12M | 490.125 | 43.632 | 5.142 | |
| 6M | 523.069 | 40.073 | 4.722 | 0.017*** |
| 12M | 490.125 | 43.632 | 5.142 |
After 180 days of yoga and preksha meditation practice, the mean EMG value in experimental group of subjects was reduced to 523.0694 ± 40.07399 mv. as compared to its initial value of 587.5833 ± 44.69009 mv. showing statistical significance (P < 0.0005). But in control group of subjects the EMG remains in similar range i.e. 583.0139 ± 47.97079 mv. (Table M" 1; Fig. R 31): This trend remains continued after 6 and 12 months of experimental intervention (581.8056 ± 47.70881 and 580.3750 ± 51.59005 mv.). Contrary to that a significant reduction in mean EMG values were noticed in experimental group of subjects at 6 and 12 months (P < 0.0005) (Table M 1 and M 2).
Table M 2: Control group
| Duration | Mean (sec.) | SD | SE | 'A' |
| 0D | 583.972 | 46.105 | 5.433 | 1.270 NS |
| 2M | 583.013 | 47.970 | 5.653 | |
| 0D | 583.972 | 46.105 | 5.433 | 0.528 NS |
| 6M | 581.805 | 47.708 | 5.622 | |
| 0D | 583.972 | 46.105 | 5.433 | 0.671 NS |
| 12M | 580.375 | 51.590 | 6.079 | |
| 2M | 583.013 | 47.970 | 5.653 | 1.422 NS |
| 6M | 581.805 | 47.708 | 5.622 | |
| 2M | 583.013 | 47.970 | 5.653 | 0.95 NS |
| 12M | 580.375 | 51.590 | 6.079 | |
| 6M | 581.805 | 47.708 | 5.622 | 1.288 NS |
| 12M | 580.375 | 51.59 | 6.079 |
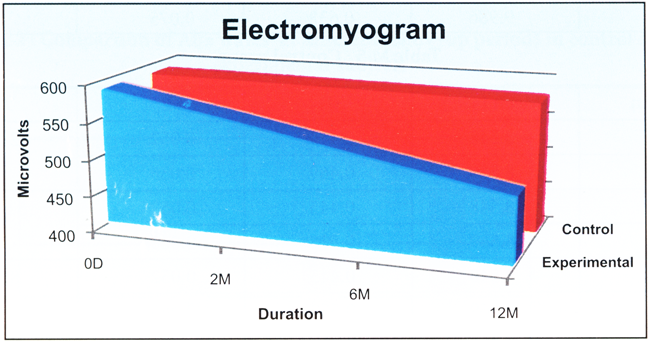
In the inter group comparison, when the values of all stages of observations in both the groups were compared with each other it was noticed that at initial stage both groups had almost similar range of EMG. But after 1st follow-up period of 2 months a significant reduction (P < 0.0005) occurred in experimental group where the value fell to 556.8611 ± 43.11639 from the basal value 587.5833 ± 44.69009 whereas in control group no such change was observed. In experimental group similar trend of reduction was continued. (Table M 3 and Fig R 31).
Table M 3: Inter-group comparison of EMG at different follow-up periods in control and experimental subjects.
| Group | Duration | Mean (sec.) | SD | SE | 't' |
| Experimental | 0D | 587.583 | 44.69 | 5.266 | 1.389 NS |
| Control | 0D | 583.972 | 46.105 | 5.433 | |
| Experimental | 2M | 556.861 | 43.116 | 5.081 | -6.814# |
| Control | 2M | 583.013 | 47.970 | 5.653 | |
| Experimental | 6M | 523.069 | 40.073 | 4.722 | -12.377## |
| Control | 6M | 581.805 | 47.708 | 5.622 | |
| Experimental | 12M | 490.125 | 43.632 | 5.142 | -14.457## |
| Control | 12M | 580.375 | 51.59 | 6.079 |
Fig. R 31: Comparison of electromyography at different follow-up periods in control and experimental subjects