 Prof. J.P.N. Mishra
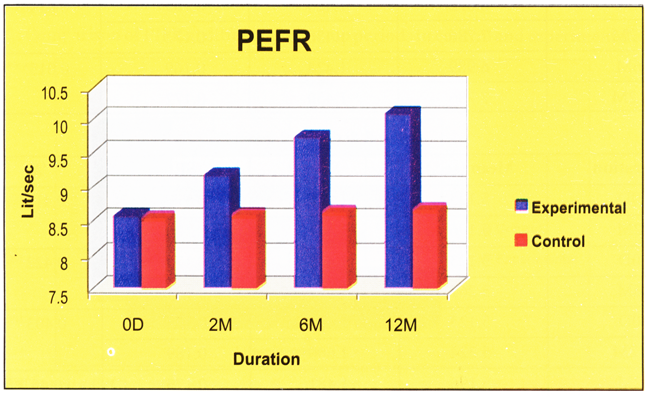
The control group of subjects has shown a slight decline in PEFR during different follow-up periods but without any statistical significance and because of unknown reasons.. The mean values being 8.5227 ± 2.17920, 8.5666 ± 2.20517, 8.6106 ± 2.25028 and 8.6472 ± 2.28215 L/sec at 0 day, 2 6 and 12 months respectively. Contrary to that there was a regular significant improvement in the PEFR of experimental group of subjects at all the three follow-up period (8.5554 ± 2 14580 9 1500 ± 2 11374 9.7120 ± 2.20925 and 10.0606 ± 2.26130 L/sec for 0 day, 2, 6 and 12 months respectively) This improvement in the mean values of experimental group of subjects at 2, 6 and 12 months were statistically significant (P < 0.0005) as shown in Tables R 4 and R 5 and Fig. R 24.
Table 34: Experimental group
| Duration | Mean (sec.) | SD | SE | 'A' |
| 0D | 8.555 | 2.145 | 0.254 | 0.022*** |
| 2M | 9.15 | 2.113 | 0.25 | |
| 0D | 8.555 | 2.145 | 0.254 | 0.023*** |
| 6M | 9.712 | 2.209 | 0.262 | |
| 0D | 8.555 | 2.145 | 0.254 | 0.024*** |
| 12M | 10.06 | 2.261 | 0.268 | |
| 2M | 9.15 | 2.113 | 0.25 | 0.024*** |
| 6M | 9.712 | 2.209 | 0.262 | |
| 2M | 9.15 | 2.113 | 0.25 | 0.025*** |
| 12M | 10.06 | 2.261 | 0.268 | |
| 6M | 9.712 | 2.209 | 0.262 | 0.035*** |
| 12M | 10.06 | 2.261 | 0.268 |
Table R 5: Control group
| Duration | Mean (sec.) | SD | SE | 'A' |
| 0D | 8.522 | 2.179 | 0.258 | 0.454 NS |
| 2M. | 8.566 | 2.205 | 0.261 | |
| 0D | 8.522 | 2.179 | 0.258 | 1.335 NS |
| 6M | 8.610 | 2.250 | 0.267 | |
| 0D | 8.522 | 2.179 | 0.258 | 0.394 NS |
| 12M | 8.647 | 2.282 | 0.270 | |
| 2M | 8.566 | 2.205 | 0.261 | 0.375 NS |
| 6M | 8.610 | 2.250 | 0.267 | |
| 2M | 8.566 | 2.205 | 0.261 | 0.473 NS |
| 12M | 8.647 | 2.282 | 0.270 | |
| 6M | 8.610 | 2.250 | 0.267 | 0.659 NS |
| 12M | 8.647 | 2.282 | 0.270 |
After the practice of yoga and preksha meditation the mean values of PEFR were increased in experimental group of subjects, which was almost similar to that of control group of subjects at the initial stages. This increase was statistically significant when compared with control group at different follow-up stages (Table R 6).
Table R 6: Inter-group comparison of PEFR at different follow-up periods in control and experimental subjects.
| Group | Duration | Mean (sec.) | SD | SE | 't' |
| Experimental | 0D | 8.555 | 2.145 | 0.254 | 0.169 Ns |
| Control | 0D | 8.522 | 2.179 | 0.258 | |
| Experimental | 2M | 9.150 | 2.113 | 0.250 | 2.765* |
| Control | 2M | 8.566 | 2.205 | 0.261 | |
| Experimental | 6M | 9.712 | 2.209 | 0.262 | 4.496# |
| Control | 6M | 8.610 | 2.250 | 0.267 | |
| Experimental | 12M | 10.066 | 2.261 | 0.268 | 5.248## |
| Control | 12M | 8.642 | 2.282 | 0.27 |
Fig. R 24: Comparison of PEER at different follow-up periods in control and experimental subjects