 Prof. J.P.N. Mishra
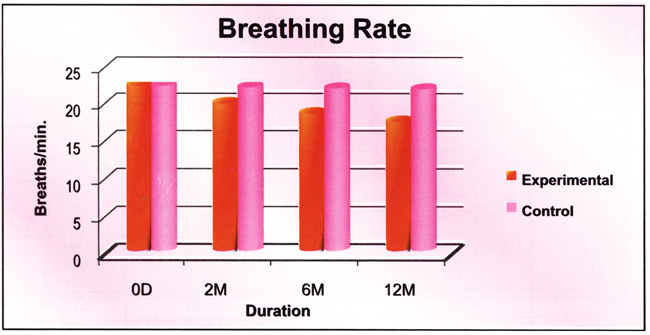
The values of breathing rate in experimental and control group of subjects were 22.0845 ± 2.55089 and 22.0845 ± 2.55089 breaths/min respectively. After 2 months of intervention (i.e. yoga and preksha meditation module) the values decreased to 19.7042 ± 1.29167 breaths/min. in experimental group showing statistical significance but in control group it remains in the same range (21.8873 ± 2.39374 breaths/min). (Table R 1 and R 2).
Table R 1: Experimental group
| Duration | Mean (sec.) | SD | SE | 'A' |
| 0D | 22.084 | 2.55 | 0.302 | 0.021*** |
| 2M | 19.704 | 1.291 | 0.153 | |
| 0D | 22.084 | 2.550 | 0.302 | 0.017*** |
| 6M | 18.366 | 1.344 | 0.159 | |
| 0D | 22.084 | 2.55 | 0.302 | 0.016*** |
| 12M | 17.267 | 1.383 | 0.164 | |
| 2M | 19.704 | 1.291 | 0.153 | 0.015*** |
| 6M | 18.366 | 1.344 | 0.159 | |
| 2M | 19.704. | 1.291 | 0.153 | 0.015*** |
| 12M | 17.267 | 1.383 | 0.164 | |
| 6M | 18.366 | 1.344 | 0.159 | 0.015*** |
| 12M | 17.267 | 1.383 | 0.164 |
The mean values of both the groups related to breathing rate were compared after 6 and 12 months of intervention. It showed a significant decrease in mean pressure of experimental group (p £ 0 0005) which came down to 18.3662 ± 1.34419 and 17.2676 ± 1.38314 breaths/min. from the basal value of 22.0845± 2.55089 breaths/min. However in control group no such change was noticed and the value remains in the same range of 21.7465 ± 2.46529 and 21.6197 ± 2.59321 breaths/min (Table R 1 and R2).
Table R 2: Control group
| Duration | Mean (B/M) | SD | SE | 'A' |
| 0D | 22.084 | 2.55 | 0.302 | 0.683 NS |
| 2M | 21.887 | 2.393 | 0.284 | |
| 0D | 22.084 | 2.55 | 0.302 | 1.347 NS |
| 6M | 21.746 | 2.465 | 0.292 | |
| 0D | 22.084 | 2.55 | 0.302 | 1.316 NS |
| 12M | 21.619 | 2.593 | 0.307 | |
| 2M | 21.887 | 2.393 | 0.284 | 3 NS |
| 6M | 21.746 | 2.465 | 0.292 | |
| 2M | 21.887 | 2.393 | 0.284 | 101 NS |
| 12M | 21.619 | 2.593 | 0.307 | |
| 6M | 21.746 | 2.465 | 0.292 | 0.728 NS |
| 12M | 21.619 | 2.593 | 0.307 |
Table R 3: Inter-group comparison of breathing rate at different follow-up periods in control and experimental subjects.
| Group | Duration | Mean (sec.) | SD | SE | 't' |
| Experimental | 0D | 22.084 | 2.55 | 0.302 | 0 NS |
| Control | 0D | 22.084 | 2.55 | 0.302 | |
| Experimental | 2M | 19.704 | 1.291 | 0.153 | -10.315# |
| Control | 2M | 21.887 | 2.393 | 0.284 | |
| Experimental | 6M | 18.366 | 1.344 | 0.159 | -14.172## |
| Control | 6M | 21.746 | 2.465 | 0.292 | |
| Experimental | 12M | 17.267 | 1.383 | 0.164 | -16.257## |
| Control | 12M | 21.619 | 2.593 | 0.307 |
The inter-group comparison of the values of breathing rate of both the groups at the beginning of experiment showed insignificant difference and the values were in similar range (22.0845 ± 2.55089 and 22.0845± 2.55089 breaths/min) in control group and experimental group respectively, but this difference became significant when the values were compared at post 2,6 and 12 months intervention as shown in Table R 3 and Fig. R 23.
Fig. R 23: Comparison of breathing rate at different follow-up periods in control and experimental subjects