 Prof. J.P.N. Mishra
The blood glucose has shown a similar range of values in both control group of subjects and experimental group of subject at 0 day of observation which was quite obvious because none of the subjects of these two groups were given any specific treatment. The basal mean fasting blood sugar levels were 81.3529 ± 4.73467 and 81.1176 ± 4.66947 mg/dl in control group and experimental group of subjects respectively.
Table C 21: Intra-group comparison of blood glucose levels of control and experimental group of subjects after 90 days follow-up duration.
| Group | Duration | Mean(mg/dl) | SD | SE | 'A' |
| Control | 0 day | 81.3529 | 4.73467 | .81199 | 0.523 |
| 90 days | 80.7941 | 4.09567 | .70240 | ||
| Experimental | 0 day | 81.1176 | 4.66947 | .80081 | 0.0642*** |
| 90 days | 79.7059 | 3.92760 | .67358 |
Table C 22: Intra-group comparison of blood glucose levels of control and experimental group of subjects after 180 days follow-up duration.
| Group | Duration | Mean(mg/dl) | SD | SE | 'A' |
| Control | 0 day | 81.3529 | 4.73467 | .81199 | 2.093 |
| 180 days | 81.1176 | 4.66947 | .80081 | ||
| Experimental | 0 day | 81.1176 | 4.66947 | .80081 | 0.0423*** |
| 180 days | 78.7059 | 4.21059 | .72211 |
After 90 and 180days of the experiment a sharp decline was noticed in the fasting blood sugar in the experimental group of subjects where the mean values were reported to be 79.7059 ± 3.92760 and 78.7059 ± 4.21059 mg/dl. The difference was statistically significant. However, in the control group the mean blood sugar at 90 and 180 days was 80.7941 ± 4.09567 and 81.1176 ± 4.6694 mg/dl, which was not statistically significant (Table C21, C22 and C23).
Table C 23: Intra-group comparative values of blood glucose at 1st follow-up (90 days) and 2nd follow-up (180 days) in control and experimental group of subjects.
| Group | Duration | Mean(mg/dl) | SD | SE | 'A' |
| Control | 90 day | 80.7941 | 4.09567 | 0.70240 | 1.198 |
| 180 days | 81.1176 | 4.66947 | 0.80081 | ||
| Experimental | 90 day | 79.7059 | 3.92760 | 0.67358 | 0.071*** |
| 180 days | 78.7059 | 4.21059 | 0.72211 |
Fig. R 19: Comparison of blood glucose levels of control and experimental group of subjects at various follow-up stages.
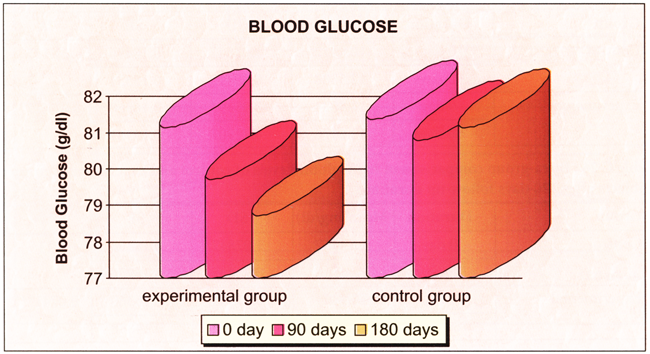
After Preksha Meditation practice the level of blood glucose reduced in experimental group of subjects, which was almost similar to that of control group at initial stage. The reductions were statistically significant when compared with control group at different follow-up stages (Fig. R9 and Table G4).
Table C 24: Inter-group comparative values of blood glucose at zero day, 1st follow-up period (90 days) and 2nd follow-up period (180 days).
| Group | Duration | Mean(mg/dl) | SD | SE | 't' |
| Control | 0 day | 81.3529 | 4.73467 | 0.81199 | 0.686 |
| Experimental | 0 day | 81.1176 | 4.66947 | 0,80081 | |
| Control | 90 day | 80.7941 | 4.09567 | 0.70240 | 3.960## |
| Experimental | 90 days | 79.7059 | 3.92760 | 0.67358 | |
| Control | 180 day | 81.1176 | 4.66947 | 0.80081 | 8.699## |
| Experimental | 180 days | 78.7059 | 4.21059 | 0.72211 |
From the above results it can be concluded that the hypothesis no 9 is accepted.