 Prof. J.P.N. Mishra
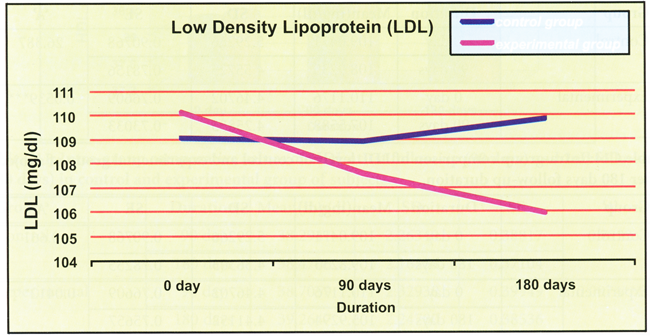
The serum LDL profile of control group of subjects has shown a regular increasing trend. The mean value of LDL in control group of subjects was found to be 109.0471 ± 5.29266 at 0 day. At subsequent observation period of 90 and 180 days it were reported to be 108.9235 ± 4.55725 and 109.8235 ± 4.56303 mg/dl respectively.
However in experimental group of subjects there was a regular decline in the mean LDL values. On 0 day the mean LDL value was 110.1176 ± 4.46702 mg/dl and at the end of 90 and 180 days the mean LDL values were reported to be 107.5588 ± 4.25855 and 105.9294 ± 4.41152 mg/dl. The change in the LDL values at 90 and 180 days have also shown statistical significance p 0.0005 (Table C13, C14 and C15).
Table C13: Intra-group comparison of LDL levels of control and experimental group of subjects after 90 days follow-up duration.
| Group | Duration | Mean(mg/dl) | SD | SE | 'A' |
| Control | 0 day | 109.0471 | 5.29266 | 0.90768 | 26.387 |
| 90 days | 108.9235 | 4.55725 | 0.78156 | ||
| Experimental | 0 day | 110.1176 | 4.46702 | 0.76609 | 0.0539*** |
| 90 days | 107.5588 | 4.25855 | 0.73033 |
Table C14: Intra-group comparison of LDL levels of control and experimental group of subjects after 180 days follow-up duration.
| Group | Duration | Mean (mg/dl) | SD | SE | 'A' |
| Control | 0 day | 109.0471 | 5.29266 | 0.90768 | 0.661 |
| 180 days | 109.8235 | 4.56303 | 0.78255 | ||
| Experimental | 0 day | 110.1176 | 4.46702 | 0.76609 | 0.0412*** |
| 180 days | 105.9294 | 4.41152 | 0.75657 |
Table C15: Intra-group comparative values of LDL at 1st follow-up (90 days) and 2nd follow-up (180 days) in control and experimental group of subjects.
| Group | Duration | Mean(mg/dl) | SD | SE | 'A' |
| Control | 90 day | 108.9235 | 4.55725 | 0.78156 | 0.4842 |
| 180 days | 109.8235 | 4.56303 | 0.78255 | ||
| Experimental | 90 day | 107.5588 | 4.25855 | 0.73033 | 0.0924*** |
| 180 days | 105.9294 | 4.41152 | 0.75657 |
The mean values of LDL in both groups at initial stage were found almost in similar range without any statistical significance. At the end of 1st follow-up stage the difference between the mean values of both groups were found to be statistically significant (p < 0.050) and at the end of 2nd follow-up stage the difference was highly significant (p < 0.001) (Table C16).
Table C16: Comparative values of LDL at different follow-up periods in control and experimental subjects.
| Group | Duration | Mean(mg/dl) | SD | SE | 't' |
| Control | 0 day | 109.0471 | 5.29266 | 0.90768 | -1.478 |
| Experimental | 0 days | 110.1176 | 4.46702 | 0.76609 | |
| Control | 90 day | 108.9235 | 4.55725 | 0.78156 | 2.012* |
| Experimental | 90 days | 107.5588 | 4.25855 | 0.73033 | |
| Control | 180 day | 109.8235 | 4.56303 | 0.78255 | 9.201## |
| Experimental | 180 days | 105.9294 | 4.41152 | 0.75657 |
Fig. R 17: Comparison of low density lipoprotein levels of control and experimental group of subjects at various follow-up stages.