 Prof. J.P.N. Mishra
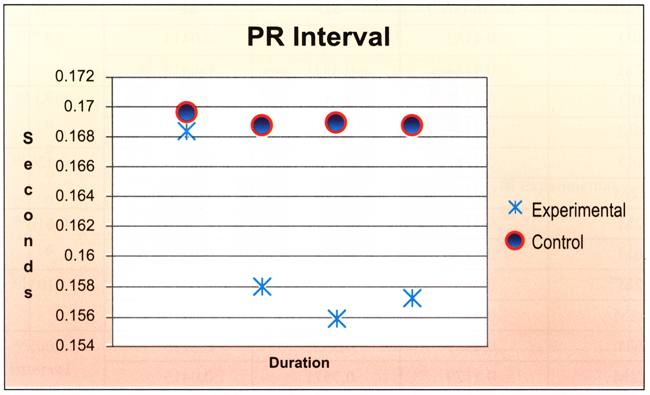
PR interval in control group of subjects was found to be 0.1696 ±.01764 sec. at 0 day which remains in similar range after 2,6 and 12 months and the values were 0.01687 ±.01823,0.01689 ±.01850 and 0.1687 ±.01913 respectively (Table E 12). Where as in experimental group of subjects it was 0.1683 ±.01815 at the onset of experiment land decreased to 0.1589 ±.01618sec. after 2 months of intervention and the trend continues after 6 months (0.1557 ±.02671sec.) and 12 months (0.1571±.03220 sec.) of intervention (Table Ell and E 12).
Table Ell: Experimental group
| Duration | Mean (sec.) | SD | SE | 'A' |
| 0D | 0.168 | 0.0181 | 0.0021 | 0.0225*** |
| 2M | 0.157 | 0.0161 | 0.0019 | |
| 0D | 0.168 | 0.0181 | 0.0021 | 0.0576*** |
| 6M | 0.155 | 0.0267 | 0.0031 | |
| 0D | 0.168 | 0.0181 | 0.0021 | 0.097*** |
| 12M | 0.157 | 0.0322 | 0.0037 | |
| 2M | 0.157 | 0.0161 | 0.0019 | 1.626 NS |
| 6M | 0.155 | 0.0267 | 0.0031 | |
| 2M | 0.157 | 0.0161 | 0.0019 | 17.696 NS |
| 12M | 0.157 | 0.0322 | 0.0037 | |
| 6M | 0.155 | 0.0267 | 0.0031 | 0.729 NS |
| 12M | 0.157 | 0.0322 | 0.0037 |
Table 20: Control group
| Duration | Mean (sec.) | SD | SE | 'A' |
| 0D | 0.169 | 0.0176 | 0.002 | 32.5 NS |
| 2M | 0.168 | 0.0182 | 0.002 | |
| 0D | 0.169 | 0.0176 | 0.002 | 6.68 NS |
| 6M | 0.168 | 0.0185 | 0.002 | |
| 0D | 0.169 | 0.0176 | 0.002 | 2.388 NS |
| 12M | 0.168 | 0.0191 | 0.002 | |
| 2M | 0.168 | 0.0182 | 0.002 | 0.457 NS |
| 6M | 0.168 | 0.0185 | 0.002 | |
| 2M | 0.168 | 0.0182 | 0.002 | 0.5525 NS |
| 12M | 0.168 | 0.0191 | 0.002 | |
| 6M | 0.168 | 0.0185 | 0.002 | 1.3673 NS |
| 12M | 0.168 | 0.0191 | 0.002 |
The mean values of PR interval of both the group of subjects, at the beginning of experiment, were in similar range without any significant difference in between them. But significant difference was observed when the mean values of control group at 2, 6 and 12 months were compared with the same of experimental group (Table E 13; Fig R 8).
Table E 13: Inter-group comparison of PR interval at different follow-up periods in control an experimental subjects.
| Group | Duration | Mean (sec.) | SD | SE | 't' |
| Experimental | 0D | 0.168 | 0.0181 | 0.0021 | -0.405NS |
| Control | 0D | 0.169 | 0.0176 | 0.0020 | |
| Experimental | 2M | 0.157 | 0.0161 | 0.0019 | -3.445* |
| Control | 2M | 0.168 | 0.0182 | 0.0021 | |
| Experimental | 6M | 0.155 | 0.0267 | 0.0031 | -3.383* |
| Control | 6M | 0.168 | 0.0185 | 0.0021 | |
| Experimental | 12M | 0.157 | 0.0322 | 0.0037 | -2.593* |
| Control | 12M | 0.168 | 0.0191 | 0.0022 |
Fig. R 8: Comparison of PR interval at different follow-up periods in control and experimental subjects