 Prof. J.P.N. Mishra
The basal mean values of S-T segment duration in experimental and control group of subjects were 0.1500 ±.00822 sec and 0.1496 ± 0.00830 sec. respectively. After 2 months of intervention (i.e. yoga and preksha meditation practice) the mean values decreased to 0.1419 ± 0.00762 sec. in experimental group showing statistical significance but in control group it remains in the same range (0.1496 ± 0.00830 sec.) (Table E 8 & E 9). Similar trend of significant decline in the mean values at of ST segment at 6 and 12 months were observed in experimental group (p £ 0.001), which came down to 0.1343 ± 0.01098 sec and 0.1279 ±.01592 sec. from the basal value of 0.1500 ± 0.00822 sec. However in control group no such change was noticed and the value remains in the same range of 0.1494 ± 0.00854 and 0.1493 ±.0924 sec. (Table E 8 and E 9).
Table E 8: Experimental group
| Duration | Mean (sec.) | SD | SE | 'A' |
| 0D | 0.15 | 0.008 | 0.0009 | 0.023*** |
| 2M | 0.141 | 0.007 | 0.0009 | |
| 0D | 0.15 | 0.008 | 0.0009 | 0.022*** |
| 6M | 0.134 | 0.010 | 0.0012 | |
| 0D | 0.15 | 0.008 | 0.0009 | 0.022*** |
| 12M | 0.127 | 0.015 | 0.0018 | |
| 2M | 0.141 | 0.007 | 0.0009 | 0.022*** |
| 6M | 0.134 | 0.010 | 0.0012 | |
| 2M | 0.141 | 0.007 | 0.0009 | 0.023*** |
| 12M | 0.127 | 0.015 | 0.0018 | |
| 6M | 0.134 | 0.010 | 0.0012 | 0.028*** |
| 12M | 0.127 | 0.015 | 0.0018 |
Table E 9: Control group
| Duration | Mean (sec.) | SD | SE | 'A' |
| 0D | 0.1496 | 0.0083 | 0.0009 | 0.635 NS |
| 2M | 0.1496 | 0.0083 | 0.0009 | |
| 0D | 0.1496 | 0.0083 | 0.0009 | 0.431NS |
| 6M | 0.1494 | 0.0085 | 0.001 | |
| 0D | 0.1496 | 0.0083 | 0.0009 | 3.253 NS |
| 12M | 0.1493 | 0.0092 | 0.001 | |
| 2M | 0.1496 | 0.0083 | 0.0009 | 0.478 NS |
| 6M | 0.1494 | 0.0085 | 0.001 | |
| 2M | 0.1496 | 0.0083 | 0.0009 | 1.14NS |
| 12M | 0.1493 | 0.0092 | 0.001 | |
| 6M | 0.1494 | 0.0085 | 0.001 | 3NS |
| 12M | 0.1493 | 0.0092 | 0.001 |
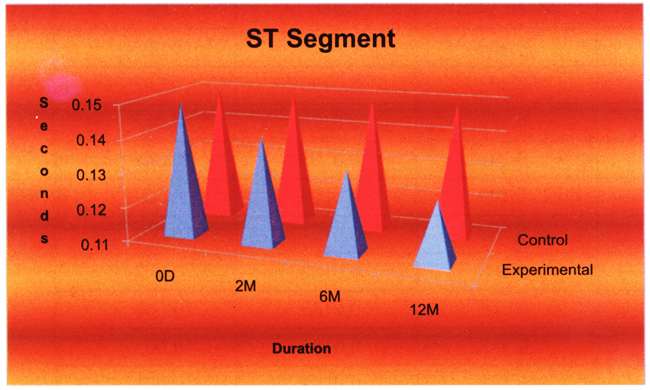
In inter-group comparison of the values of S-T segment duration in both the groups at the beginning of experiment showed insignificant difference and the values were in similar range, but this difference became significant when the values were compared at post 2, 6 and 12 months of intervention as shown in table E 10 and Fig. R 7.
Table 10: Inter-group comparison of ST segment at different follow-up periods in control and experimental subjects.
| Group | Duration | Mean | SD | SE | 't' |
| Experimental | 0D | .1500 | .00822 | .00097 | .309 Ns |
| Control | 0D | .1496 | .00830 | .00098 | |
| Experimental | 2M | .1419 | .00762 | .00090 | -5.664# |
| Control | 2M | .1496 | .00830 | .00098 | |
| Experimental | 6M | .1343 | .01098 | .00129 | -9.020# |
| Control | 6M | .1494 | .00854 | .00101 | |
| Experimental | 12M | .1279 | .01592 | .00188 | -9.660# |
| Control | 12M | .1493 | .00924 | .00109 |
Fig. R 7 Comparison of ST segment at different flow-up periods in control and experimental subjects