 Prof. J.P.N. Mishra
An action potential propagate through the heart, they generate electrical currents that can be detected at the surface of the body. An electrocardiogram (ECG) is a recording of the action potentials produced
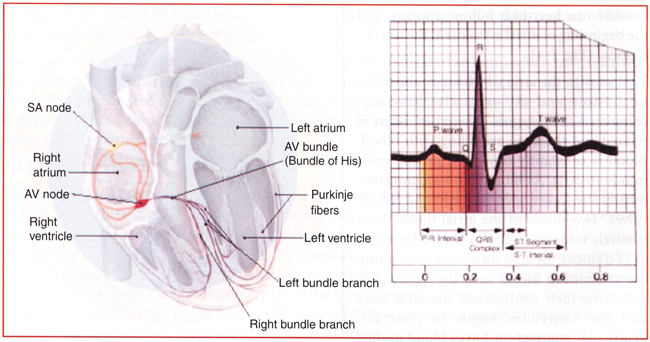
Fig. 1-5. Conduction pathway of the heart. The electrocardiogram tracing is of one normal heartbeat.
by all the heart muscle fibres during each heartbeat. The ECG instrument used to record the change is an electrocardiograph. Electrodes are positioned on the arms and legs (limb leads) and at six positions on the chest (chest lead) to record the ECG. The electrocardiograph amplifies the heart's electrical signals and produces 12 different tracing from different combinations of limb and chest lead. Each limb and chest electrode records slightly different electrical activity because of the difference in its position relative to the heart. By comparing these recording with one another and with normal records, it is possible to determine
- If the conducting path is abnormal.
- If the heart is enlarged.
- If certain regions of the heart are damaged.
- The cause of chest pain.
In a typical record, three clearly recognizable waves appear with each heartbeat (Fig. 1-5). The first, called the P wave, is a small upward deflection on the electrocardiograph. The P wave represents arterial depolarization, which spread from the SA node through contractile fibres in both atria (Tortora at. el., 2006).
The second wave, called the QRS complex, begins as a downward deflection, continues as a large, upright, triangular wave and ends as a downward wave. The QRS complex represents rapid ventricular contractile fibres. The third wave is a dome-shaped upward deflection the T wave. It indicates ventricular re-polarization and occurs just as the ventricles are starting to relax.
The T wave is smaller and wider than the QRS complex because re-polarization occurs more slowly than depolarization. During the plateau period of steady depolarization the electrocardiogram tracing is flat (Tortora at. el., 2006). In reading an ECG, the size of the wave can provide clues to abnormalities. Larger P wave indicate enlargement of an atrium; an enlarged Q wave may indicate a myocardial infraction; and an enlarged R wave generally indicates enlarged heart muscle is receiving insufficient oxygen. The T wave may be elevated in hyperkalaemia (high blood K+ level).
Analysis of an EEG also involves measuring the time span between waves, which are called intervals or segments. The P-Q interval is the time from the beginning of P wave to the beginning of QRS complex. It represents the conduction time from the beginning of arterial excitation to the beginning of ventricular excitation. Put another way, the P-Q interval is the time required for the action potential to travel through the atria, atrioventricular node, and the remaining fibres of the conduction system. As the action potential is forced to the detour around scar tissue caused by disorders such as coronary artery disease and rheumatic fever, the P-Q interval lengthens.
The S-T segment, which begins at the end of the S wave and ends at the beginning of the T wave, represents the time when the ventricular contractile fibres are depolarized during the plateau phase of the action potential. The S-T segment is elevated (above the baseline) in acute myocardial infraction and depressed (below baseline) when the heart muscle receives insufficient oxygen.
The QT interval represents the duration of ventricular systolic. It is measured from the onset of the QRS complex to the end of the T wave. Since the normal QT interval varies with the heart rate, the QTc or the corrected QT interval is used clinically instead of the QT interval. The QTc is calculated form the QT interval and the heart rate using the formula of Bazett. The normal QTc should not exceed 0.42 sec. It is the time from the beginning of ventricular depolarization to the end of ventricular re-polarization. The Q-T interval may be lengthened by myocardial damage, myocardial ischemia (decreased blood flow) or conduction abnormalities. RRIV indicates the time between two successive R peaks. RR interval variation denotes the ventricular rate.
Some time it is helpful to evaluate the heart's response to stress of physical exercise (stress testing). Although narrowed coronary arteries may carry adequate oxygenated blood while a person is at rest, they will not be able to meet the heart's increased need for oxygen during strenuous exercise. This situation creates change that can be seen on an electrocardiogram (Tortora at. el., 2006).